Debugging a NuttX Application
This tutorial consists of two parts: First, debugging a NuttX target with GDB and OpenOCD. This part covers tool installation and debugging via command line. Second, debugging with Visual Studio Code, i.e. using a modern IDE.
Debugging a NuttX target with GDB and OpenOCD
Rare is the program that works on the first try – so you will usually need a debugger. This is even more true on an embedded device, where “printf”-style debugging is very cumbersome.
There are many tools for embedded debugging. This tutorial will show you how to debug on the command line, using the GNU Debugger gdb and the Open On-Chip Debugger, OpenOCD. These two open source tools are readily available on Linux, and they form the basis for many more advanced tools, including graphical debuggers.
NuttX integration for OpenOCD is relatively new as of the time of writing (early 2019), so this tutorial also includes instructions on how to get and configure it.
Pre-Requisites
Hardware
- a supported embedded board
- a support debugger probe
Software
- a NuttX development setup, including gdb
- OpenOCD-Nuttx (but we will show to install that)
Install OpenOCD-Nuttx
Sony has added NuttX support to OpenOCD, and most importantly, this includes thread info. Since NuttX is a real RTOS with support multiple tasks/threads, you need thread support to look at anything other than the currently active task.
Get the code
The repository is on GitHub at https://github.com/sony/openocd-nuttx. Check it out like this:
git clone --depth 1 https://github.com/sony/openocd-nuttx
(the ‘–depth 1’ is not required, but it saves you from downloading unnecessary data)
Do not compile openocd just yet!
Determine your NuttX configuration
NuttX sometimes switches around the memory location of the necessary information, so we need to configure OpenOCD for the currently used NuttX version.
Put the following into your .gdbinit:
define print-offset
 printf "#define PID  %p\n",&((struct tcb_s *)(0))->pid
 printf "#define XCPREG  %p\n",&((struct tcb_s *)(0))->xcp.regs
 printf "#define STATE %p\n",&((struct tcb_s *)(0))->task_state
 printf "#define NAME %p\n",&((struct tcb_s *)(0))->name
 printf "#define NAME_SIZE %d\n",sizeof(((struct tcb_s *)(0))->name)
end
Then run gdb on your nuttx binary and run this function:
arm-none-eabi-gdb nuttx
(gdb) print-offset
On Nuttx 7.27, the result should look something like this:
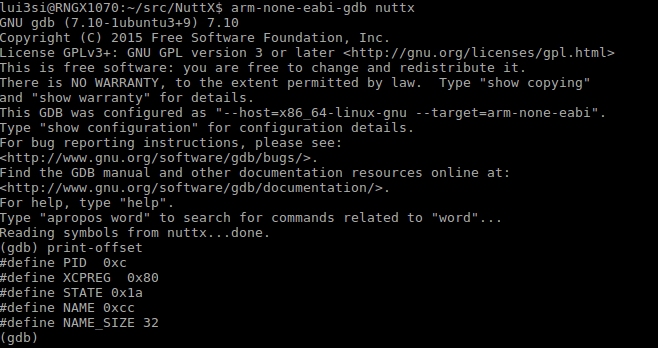 The interesting bits are the
 #define statements at the end,
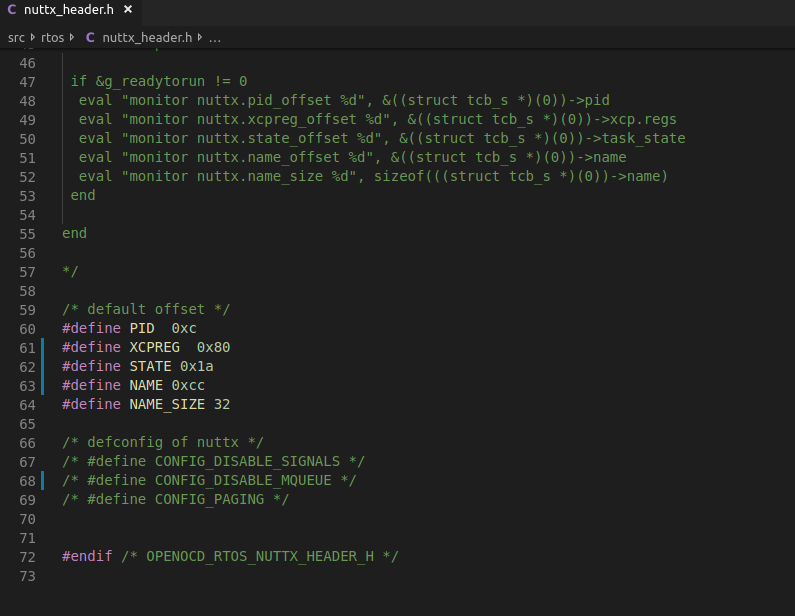
Now open openocd-nuttx/src/nuttx_header.h in your favor editor, locate the existing #define lines
and replace them with what you got. The result should be like this:
Configure OpenOCD for NuttX support
OpenOCD has a set of target configurations for the various boards. Since the boards could run one of many RTOS’s, the default configuration doesn’t specify any particular one – so we have to add it.
When using the Olimex STM32-E407 board, one of our standard boards, the target configuration file is stm32f4x.cfg and it is normally located in tcl/target/. For your hardware, it might be a different file, so be sure to use the right one.
Open the target configuration and locate a line starting with $_TARGETNAME configure. Then add -rtos nuttx to this line.
Compile OpenOCD
NOTE The Sony OpenOCD branch has some compile issues on Ubuntu 18.04 right now, because it uses a newer compiler. The easiest “solution” is to remove the -Werror from your compile. We’ll submit a patch soon.
To compile and install OpenOCD, after you made your changes, run
./bootstrap
./configure
make
sudo make install
Test OpenOCD
To test OpenOCD, try the following command line:
/usr/local/bin/openocd -f /usr/share/openocd/scripts/interface/ftdi/olimex-arm-usb-ocd-h.cfg -f stm32f4x.cfg -c init -c "reset halt"
The output should look as in the following image:
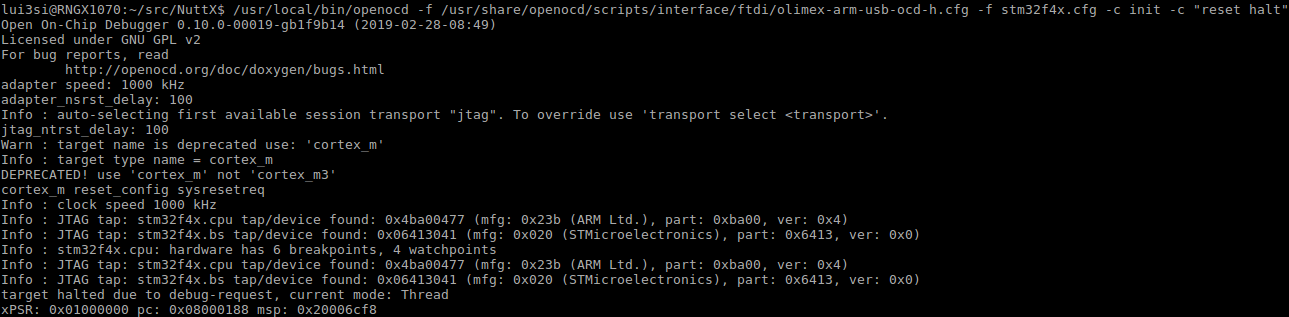
OpenOCD will then block, waiting for a debugger to attach, so lets do that in the next section.
Running GDB with OpenOCD
Run gdb in your NuttX directory as follows:
arm-none-eabi-gdb nuttx
(gdb) target extended-remote :3333
(gdb) cont
This connected to the gdb server running on port 3333 (OpenOCD default) of the same machine. It will sit on the NuttX _start function, which isn’t very interesting, so we let it continue.
At this moment we have not defined any breakpoints, yet, so you can just press Ctrl-C to interrupt the running program again. This will interrupt it after NuttX had a chance to do initialization, so we will actually get to see some data.
Inspect the program
Now, if everything worked correctly, we should get some information from the RTOS, such as thread info. To test, type info threads at the gdb prompt to get a thread info table. Your output will very depending on the NuttX configuration. On my bare-bones NSH-only configuration, it looks as follows:
 So we see four threads, two of which are the OS work queues, one is the init thread, and one is the idle thread.
Most likely, NuttX has stopped in the idle thread, which isn’t very interesting. To inspect the others, we can use the thread command to switch a thread and then maybe display a backtrace and some variables. Try the following:
thread 2
info locals
print rtcb
print *rtcb
This switches to thread 2 and then inspects the local variables, of which there are two, one being called rtcb. We print it, see its a pointer to a structure, so we dereference and print again to display all the structure fields. This should look something like the following:
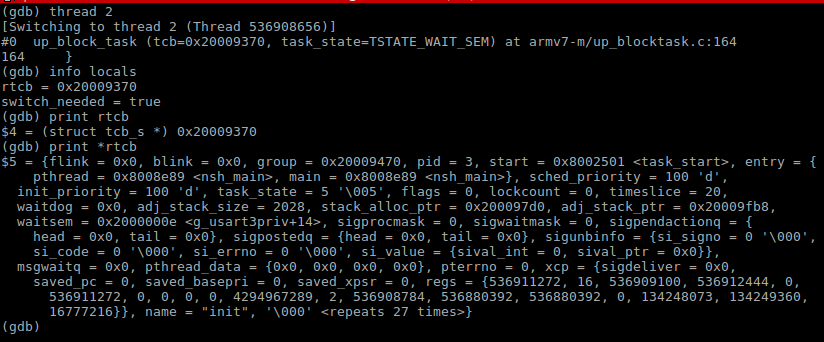 In my case, this is the NSH thread which is waiting for some input.
Debugging with Visual Studio Code
This is a follow-up to the tutorial above, because the set up done in that tutorial is a pre-requisite to debugging with Visual Studio Code.
Motivation
Visual Studio Code is a modern IDE that is very easy to extend and popular with both the Web/Cloud and IoT communities. It is also one of the easiest IDEs to get working with embedded systems. That said, it is not the most powerful or featureful IDEs for this purpose, but it is easy and will do.
Prerequisites
- All the prerequisites of Debugging a NuttX target with GDB and OpenOCD
- Cortex-M hardware (all of our standard boards are ARM based)
- Visual Studio Code
Installing Cortex-Debug
In the extensions marketplace, enter “cortex”, then install “Cortex-Debug”. Depending on your version of Visual Studio Code, you may need to restart after installing the extension.
Set up your project for debugging
Open your project folder in Visual Studio Code – this is usually the NuttX folder, or a subdirectory of apps.
Create a Visual Studio Code launch configuration for NuttX
From the Debug menu, select Open Configurations. This will open a `launch.json’ file. See Cortex-Debug Launch configurations for documentation.
To get started, I have prepared a working launch configuration for using our STM32-E407 board with the ARM-USB-OCD-H jtag probe. If you use a different board or probe, you only need to replace the configFiles section. Each entry in the section is an argument that you would normally pass as a -f option to OpenOCD.
{
    "version": "0.2.0",
    "configurations": [
        {
            "name": "Debug (OpenOCD/NuttX)",
            "cwd": "${workspaceRoot}",
            "executable": "nuttx",
            "request": "launch",
            "type": "cortex-debug",
            "servertype": "openocd",
            "device": "stm32f4x",
            "configFiles": [
                "interface/ftdi/olimex-arm-usb-ocd-h.cfg",
                "target/stm32f4x.cfg"
            ]
        }
    ]
}
The name is what will appear in the status bar for running it.
Running the debugger
Either press F5 or select Debug/Start Debugging from the menu to get started. This will take a moment, and then you should get a red status bar and the debug window, like in the following image:
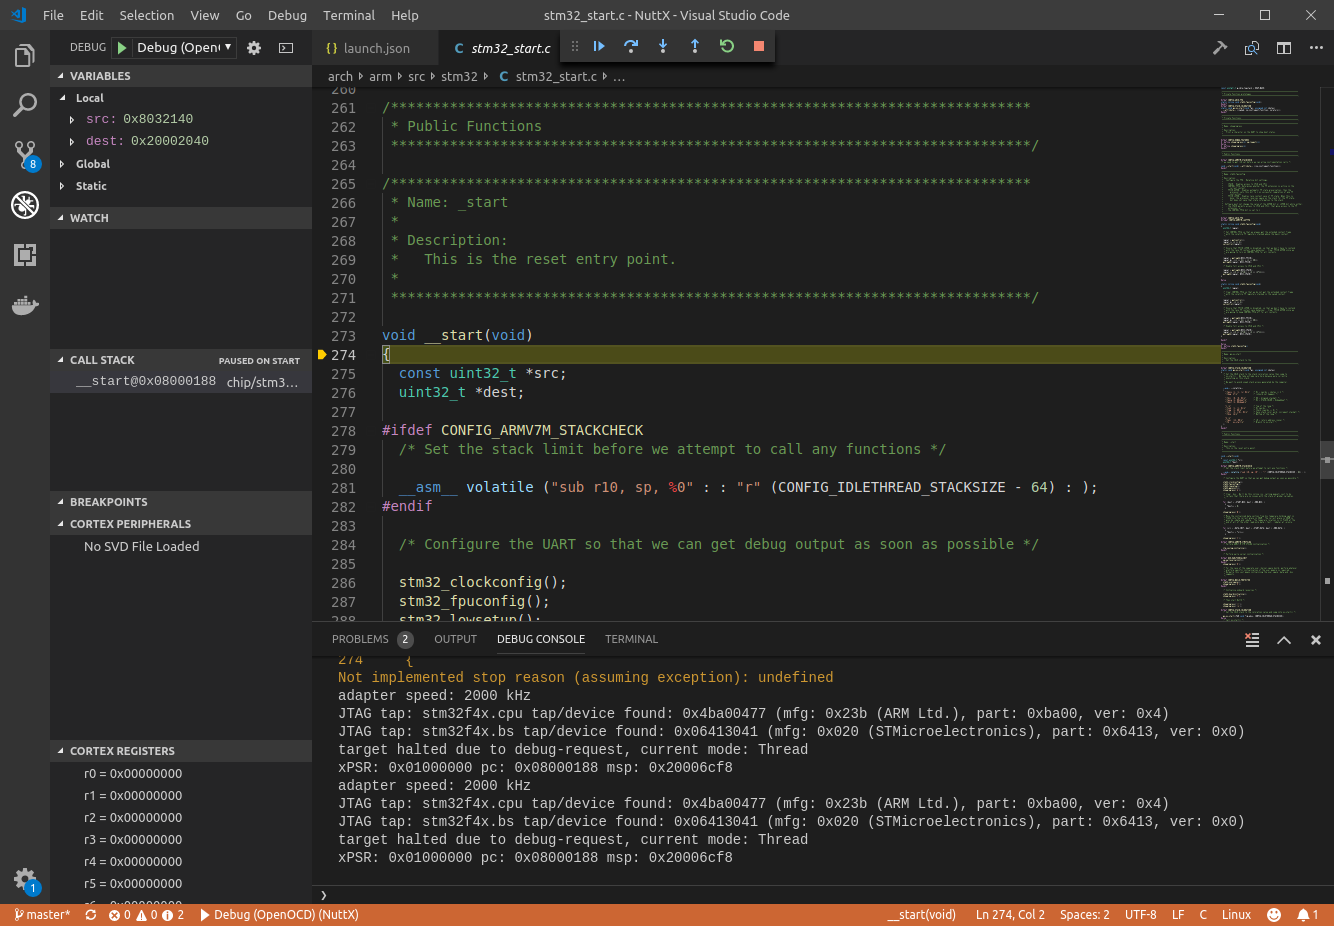
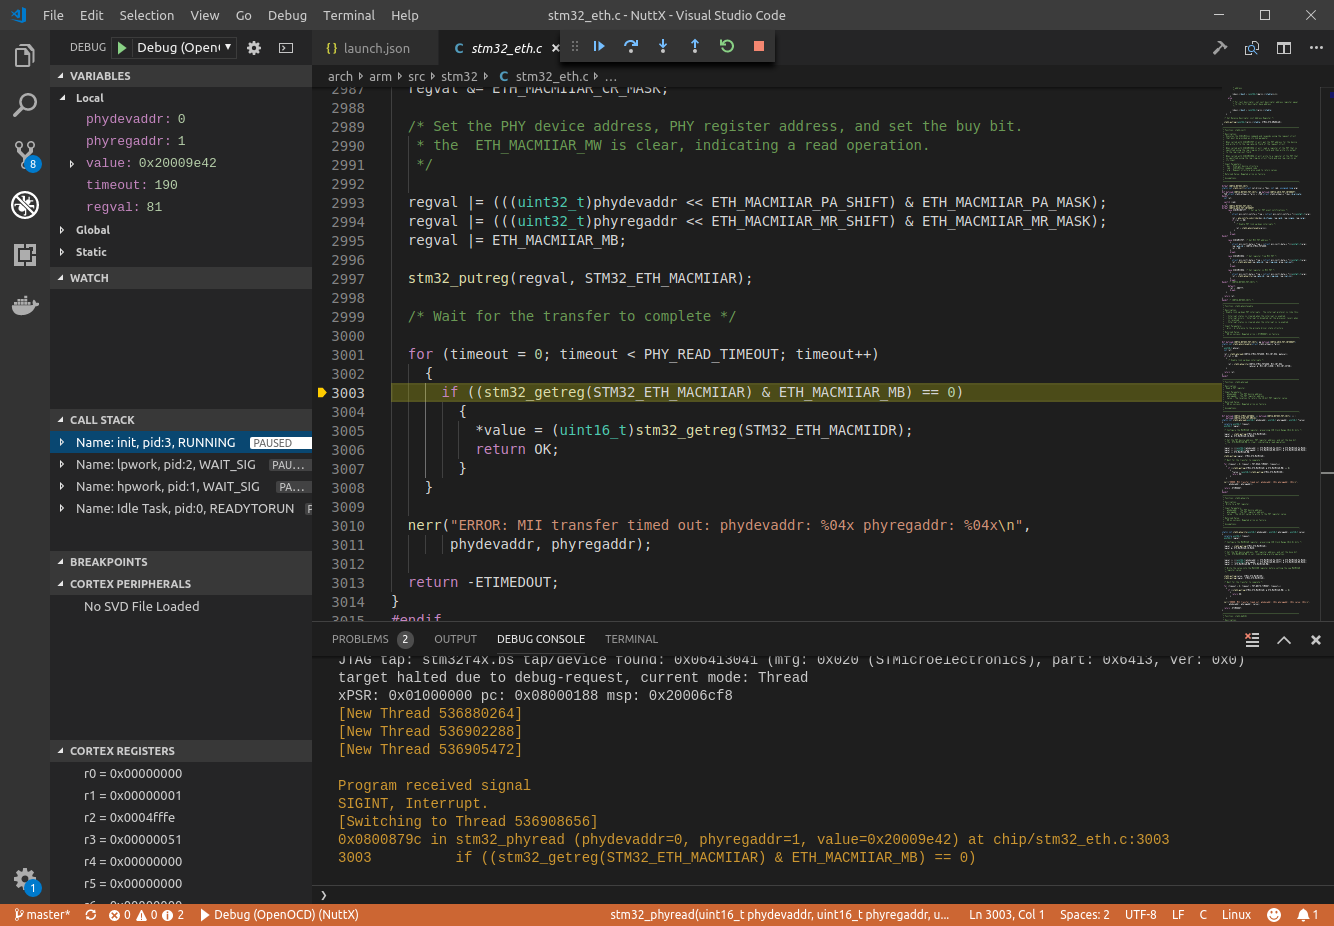
As in the gdb tutorial, initially you won’t see much because the program is stopped during OS initialization. Press F5 again or click the “play” button from the debug menu at the top of the window, wait a few seconds, then press F6 or click the pause button. The window should change to give you thread, variable, and register information, like in the following. Note that “Call Stack” window displays multiple threads.
Adding an SVD File
You may have noticed that on the left-hand side, there is a sub-window called “Cortex Peripherals” which simply states “No SVD File loaded”. SVD means “System View Description” and is a standard format which microcontroller vendors use to describe the available features of their MCUs.
For example, in the case of our STM32-E407 board, which features an STM32F407ZGT6 MCU, we can download the SVD description from STM’s web-page for the STM32F407ZG series. In the “HW Model, CAD Libraries & SVD”, you will find a link to the STM32F4 series SVD.
Extract the SVD and then add an svdFile attribute to the launch configuration. The full configuration will look like this:
{
    "version": "0.2.0",
    "configurations": [
        {
            "name": "Debug (OpenOCD/SVD)",
            "cwd": "${workspaceRoot}",
            "executable": "nuttx",
            "request": "launch",
            "type": "cortex-debug",
            "servertype": "openocd",
            "device": "stm32f4x",
            "svdFile": "STM32F407.svd",
            "configFiles": [
                "interface/ftdi/olimex-arm-usb-ocd-h.cfg",
                "target/stm32f4x.cfg"
            ]
        }
    ]
}
Run the debugger again, and your window should look as follows:
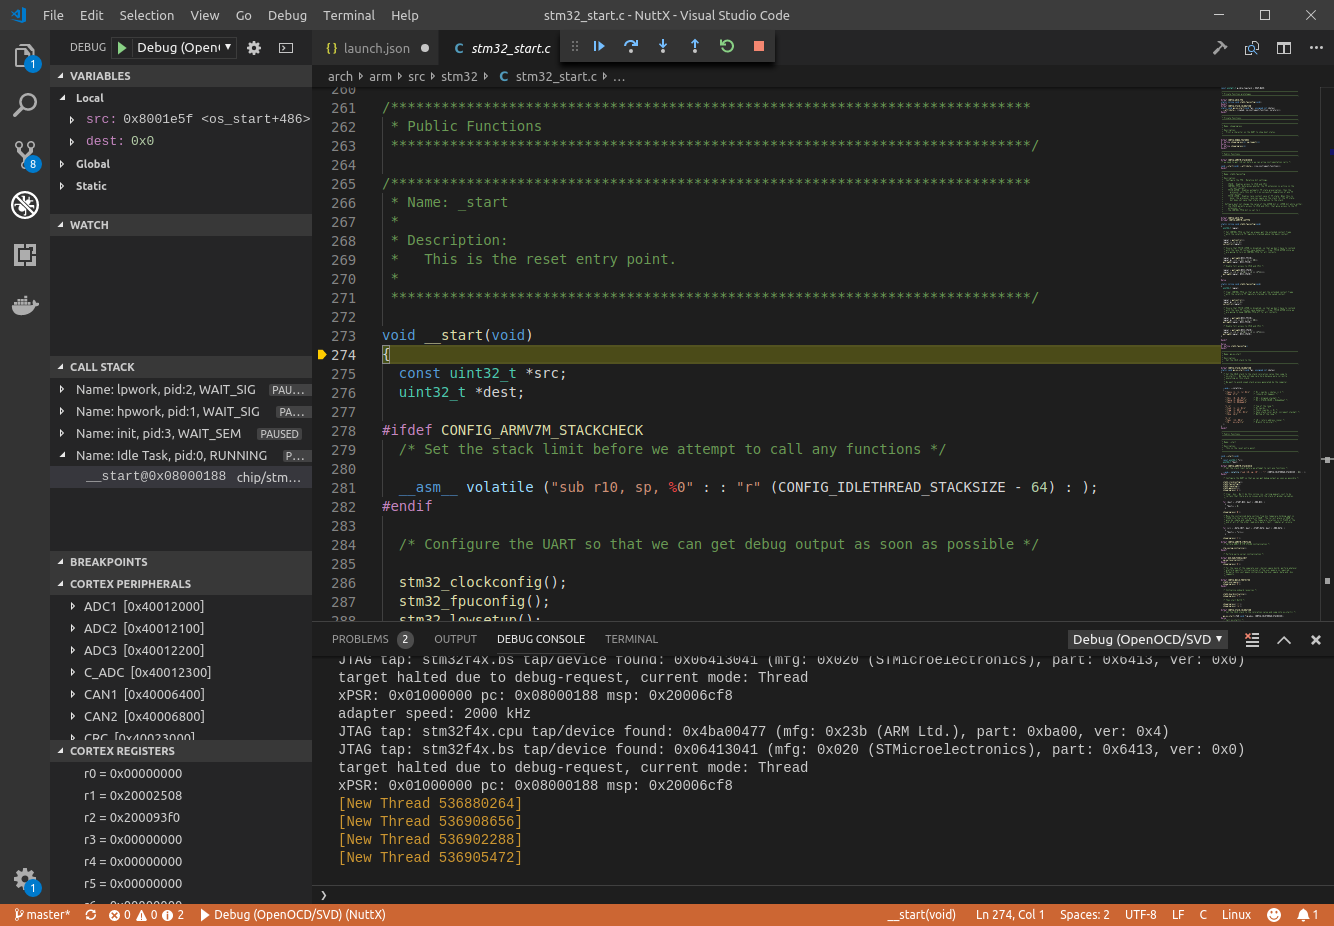
Voilà! The Cortex Peripherals is populated with everything that the STM32F407 MCU has to offer. Please note that not all of these peripherals might actually be connected on the board. However, those that are, and that are used in your application, can easily be investigated like this.